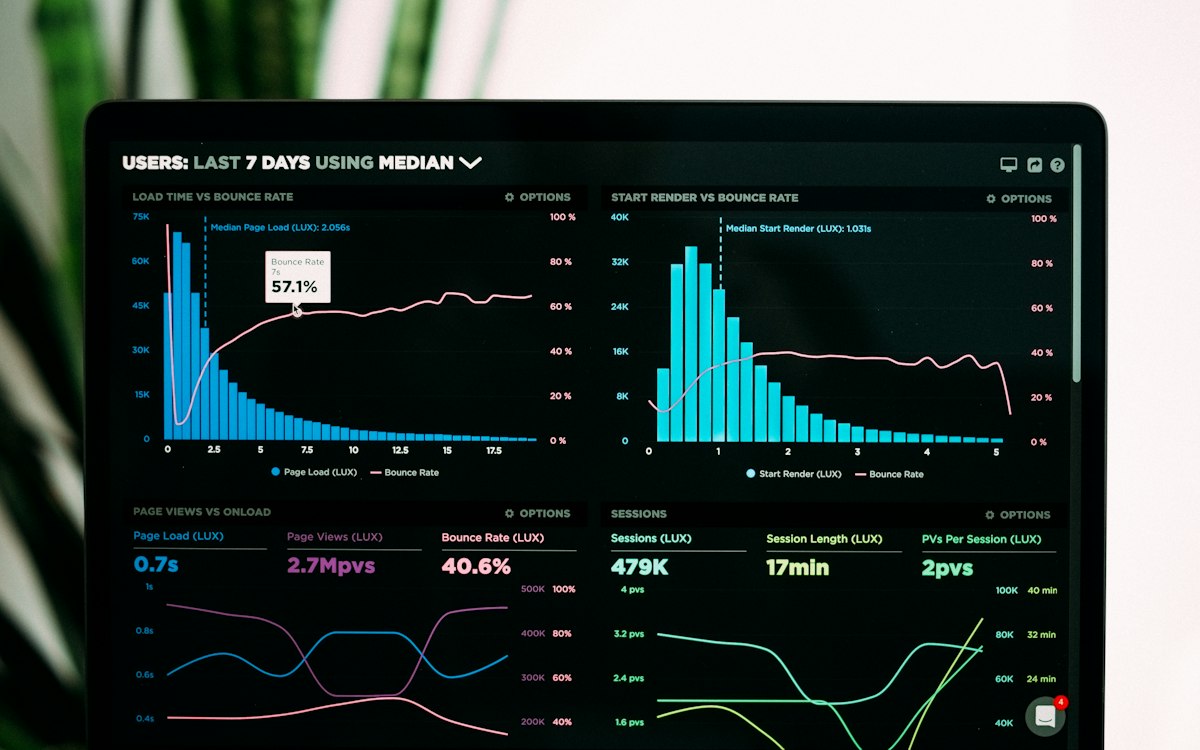
I’ve shipped glossy Power BI and Sheets packs that nobody returned to. I’ve also shipped plain trackers that ran every Monday review for years. The difference wasn’t the tool or the colour palette. It was whether the pack answered the decisions on the agenda: before the meeting started, not after someone asked for a screenshot.
Most reporting projects fail quietly. The dashboard goes live, gets praised in the kickoff, and then dies in the inbox. Leaders go back to asking for ad hoc exports because the pack doesn’t match how they actually run the business. Fixing that doesn’t require a bigger data team. It requires building around decisions, not datasets.
Start from the agenda, not the data warehouse
Before you open Power BI or Google Sheets, list the five questions leadership asks every cycle. Pipeline health. Aging receivables. Open tickets past SLA. Delivery slips. Headcount versus plan. These are not abstract KPIs: they are the reasons the review exists.
Build only the views that answer those questions. Everything else waits. I’ve seen teams spend weeks on a beautiful geographic heat map while the CFO still opens a separate file for collections. The heat map wasn’t wrong. It just wasn’t on the agenda.
One practical test: print the review agenda and put a check mark next to each item the dashboard covers without a follow-up question. If you can’t check most of them, you’re building decoration.
One screen per decision
Crowded dashboards force people back to Excel. When everything competes for attention, nothing gets acted on. Give each decision a clean surface: the trend, the current number, the owner, and what changed since last review.
If you need a second click for detail, that’s fine. Don’t lead with noise. A collections lead should see overdue amount, top five accounts, and who owns each follow-up: not twelve charts that require interpretation. The goal is a five-second read that tells you whether to escalate or move on.
Names beat job titles
A red KPI with no owner is theatre. Put a person’s name next to each line: not “Finance” or “Ops,” but the individual who will explain the number if it moves. When the receivables figure spikes, someone should know they owe an update before the call, not during it.
This sounds obvious, but most packs still show department labels. Departments don’t answer emails at 9 p.m. People do. Named ownership also makes it easier to retire metrics: if nobody has claimed a chart in two cycles, it probably doesn’t matter.
Freshness is a feature
Show last refresh time in plain language, “Updated today at 7 a.m.” not “ETL completed.” Stale data trains leaders to ignore the pack. If they’ve been burned twice by numbers from last Tuesday, they’ll stop opening it entirely.
Automate the refresh where you can. Document the manual steps where you can’t. If a metric depends on someone uploading a file every Friday, say so on the dashboard itself. Transparency about freshness builds more trust than pretending everything is real-time.
Kill charts that don’t change behaviour
After two review cycles, drop anything that never drove an action. I keep a simple log: did this metric change a decision, trigger an escalation, or get referenced outside the meeting? If the answer is no twice in a row, cut it.
Dashboards should shrink as trust grows. That’s a good sign, not a failure of “analytics maturity.” A pack that gets smaller but gets opened more often is doing its job. The opposite: growing every quarter with new widgets nobody uses: is how reporting becomes shelfware.
The takeaway
A dashboard leaders actually use is one they open before the review, not one they’re shown during it. Start from the agenda. One screen per decision. Named owners. Visible freshness. Ruthless pruning. The tool matters less than whether the pack earns a place in Monday morning’s routine.